For those watching US labor market, one can not miss a difficult question. Since 08 financial crisis, change in non-farm payrolls and unemployment rate steadily recover, but labor participation rate continues to fall. It started from 66.2% in Jan 2008 to 62.7% in Jan 2016. It appears that even when job market continues to recover, more and more labor leave job market altogether. This bizarre contrast makes observers question the strength of job market recovery. One common theory for this phenomenon is that baby boomers see a retirement wave, which causes a structure change and leads to significant drop in labor force participation rate. This theory is intuitive, but is not consistent with all data, so it is not convincing. Here I offer a different perspective of this problem.
First, let's look at Fig.1 and Fig. 2. Fig. 1 is straightforward. When the number of employed labor goes down, unemployment rate goes up, and vice versa. Fig. 2 is straightforward too, but it is worth noting that participated labor is steady most of the time and increases slight since 2014. It appears that in the worst time of the job market post financial crisis, the number of participated labor did barely change. It doesn't seem to support the retirement wave theory. If the theory were true, there would have been a visible dip in the number of participated labor.
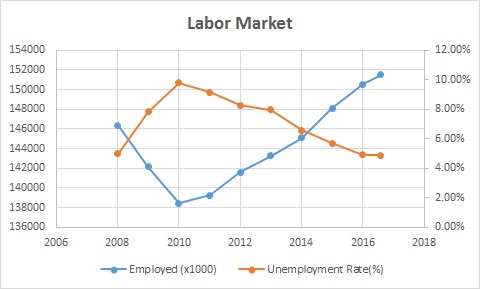
Figure 1 - Employed Labor vs Unemployment Rate

Figure 2 - Employed Labor vs Participated Labor
Now let's examine the labor force participation rate. Participation rate is the ratio between labor participating in the job market against total labor force. Participated labor includes employed labor and unemployed labor actively seeking for jobs. Fig. 3 shows that even when the number of employed labor bounces back, participation rate continues to drop. More and more people simply leave job market permanently.
As noted in Fig. 2, the number of participated labor has increased slightly. Large drop in participate rate can have only one reason mathematically, which is that the number of total labor has gone up significantly. Fig. 4 shows that labor force increases 1% per year. This rate is even higher than population growth. There may be a subtle structure change.
If the growth rate of labor force continues to stay at 1% per year, there is about 2536K increase in labor force per year. To keep unemployment rate and participation rate status quo, 1515K jobs is needed each year, which is about 126K per month. If job growth is less than this level, then either unemployment rate will go up, or participation rate will go down, or both. Luckily, in past 12 months, there are 204 jobs created per month on average.

Figure 3 - Labor Force Participation Rate

Figure 4 - Labor Growth Rate and Population Growth Rate
No comments:
Post a Comment